Every day, around 79 people will hear the devastating and life changing words ‘you have a brain tumour’.
This diagnosis prompts a thousand questions from the profound to the practical. It’s also accompanied by loneliness and desolation. This is where brainstrust comes in. We are here for people, to coach them to be resilient and resourced, and to give them the answers and support they need in their time of need.
However, many who are diagnosed with a brain tumour will face the road ahead without the support and information they need. It’s time for this to change.
From 25th October to 1st November 2025, Wear Grey returns. This community campaign is to show people they are not alone, to raise the profile of this devastating disease and to raise vital funds to help ensure everyone affected by a brain tumour diagnosis, gets the support they need to live their best life possible.
In 2012 Shaun Skinner came to us with an idea, on 1st October he wanted to turn the world grey to raise awareness around brain tumours. Shaun had been diagnosed with a malignant brain tumour in 2007 and was a passionate advocate for the brain tumour community, raising the profile of an invisible illness and the people living with it.
We were devastated when Shaun died in 2017, but we are proud to have been tasked by Shaun to continue Wear Grey. All who knew Shaun now work to grow this event beyond Shaun’s wildest expectations. He has started something incredible that is changing the world for people who are lost, afraid and alone in the face of a brain tumour diagnosis.
We Wear grey as a tribute to Shaun, and everyone whose lives have been lost or affected by a brain tumour.
Shop Grey
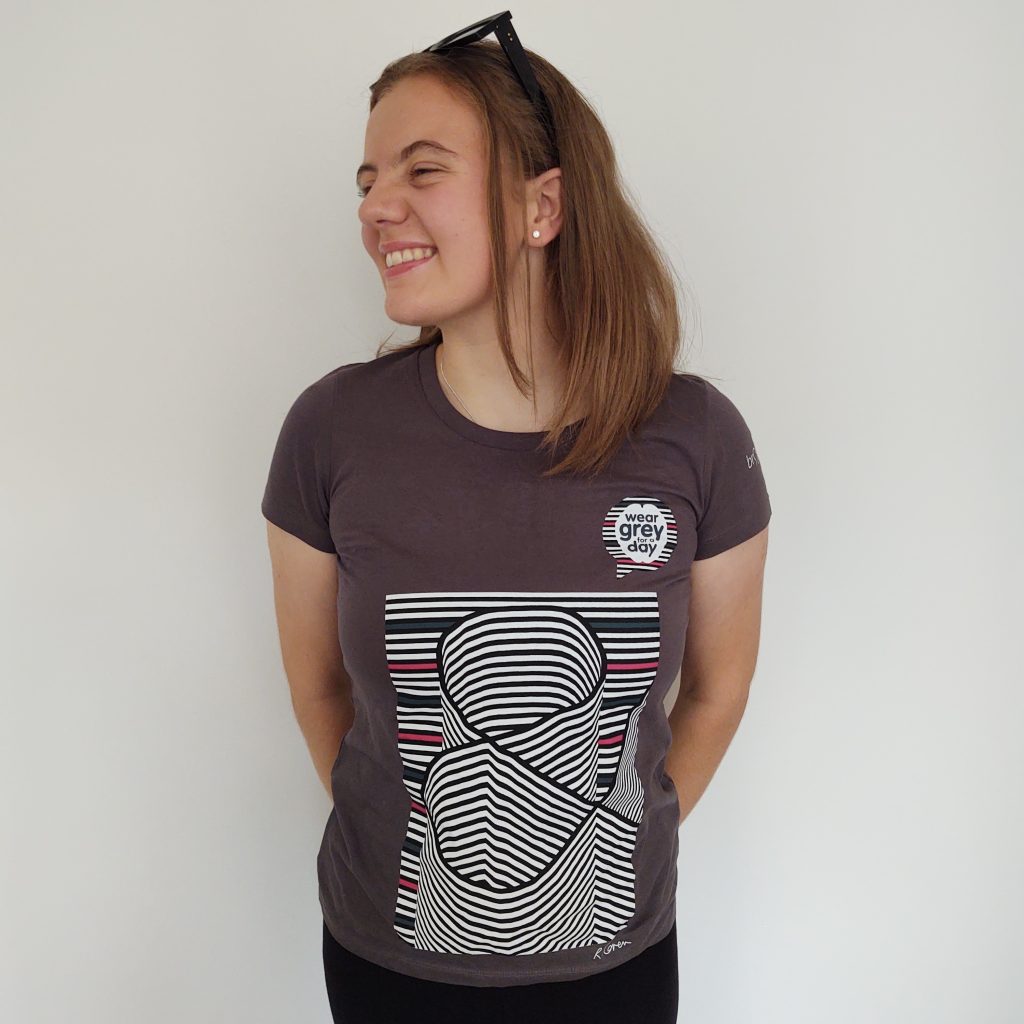
We Wear Grey to make sure no one has to face a brain tumour alone. Get your Wear grey merchandise today and show your support for the brain tumour community.
Our shops host a broad range of merchandise from tees to hoodies, beanies to buffs – there’s sure to be something that fits your style so that you can Wear grey your way.
When you buy from our shop, be assured that every penny goes towards making sure people diagnosed with a brain tumour get the support they need to live their best life possible.
Each year we launch a new line of merchandise for you to pick up and show your support for the community. This year’s limited CHOOSE GREY line has just landed with us and is now available for purchase through our web store!
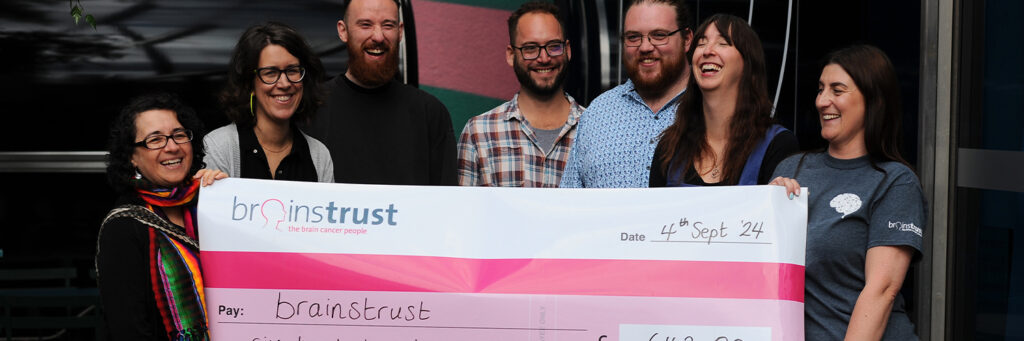
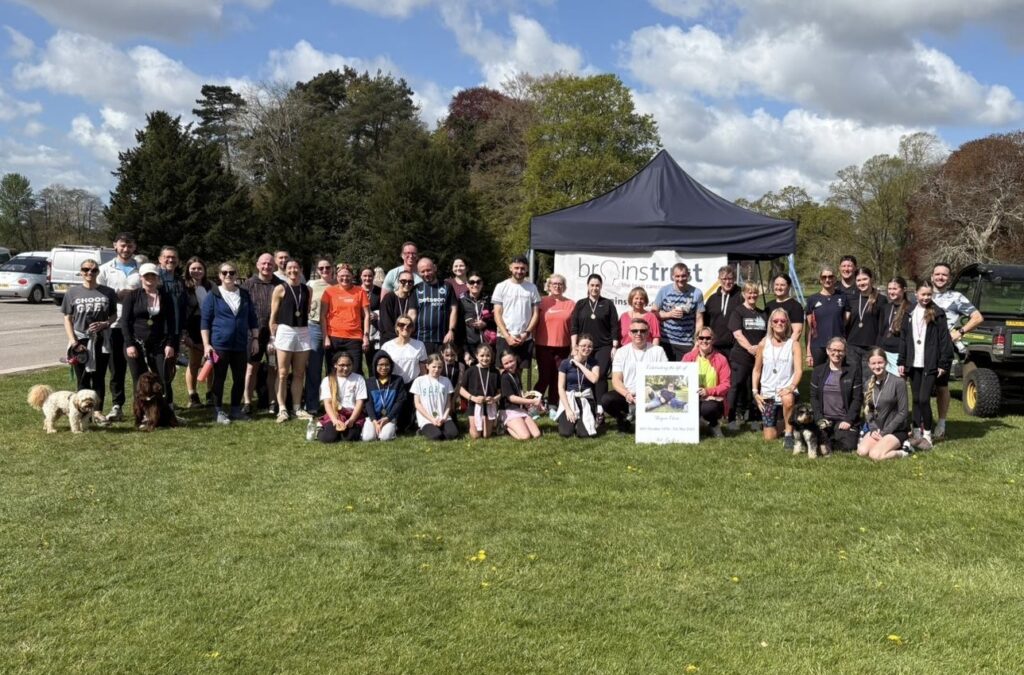
Over the years this campaign has reached over 1 million people and has raised tens of thousands of pounds for brainstrust’s work. This is because it is easy to join in. Help us reach more people with vital coaching and support, and help the world understand what people with a brain tumour is up against – simply pick a day between the 25th of October and the 1st of November, choose something grey to wear, and let people know why you chose grey. We also encourage you to make a small donation online to brainstrust, or to our Wear Grey Just Giving page. Don’t forget to share your day in grey on your socials and use #brainstrust #weargrey
You can of course take Wear Grey further. Take the day to work or school and encourage colleagues to take part. Hold a Wear Grey coffee morning of cake sale, go for a run in grey, skydive in grey, or turn your local pub or social group grey with a quiz. Whatever you have up your (grey) sleeves, we can help. Simply get in touch and let us know what you’re thinking and we’ll be right beside you.
Wear Grey has reached many many people over the years, and the campaign raises awareness of the hidden challenges we face, and also the support that is available.
We can only do this with your voice. If you or a someone you love or care for has been affected by a brain tumour your experience is vital. Share your support for Wear Grey in 2 ways:
01
Make a short video of you wearing grey and, explain in the video why you are supporting Wear Grey and brainstrust’s mission to support and help the world understand. All you have to do is post your video or to your channels and don’t forget to #brainstrust and #weargrey. Listen to our CEO Will describe why he’s wearing grey this year.
02
Post an update to your social channels. Finish the sentence “I Wear Grey today, for the people of brain tumour community and brainstrust so that…” And use #brainstrust and #weargrey
We're here to help and for the close family and friends whose lives have been turned upside down when they've been told you have a brain tumor